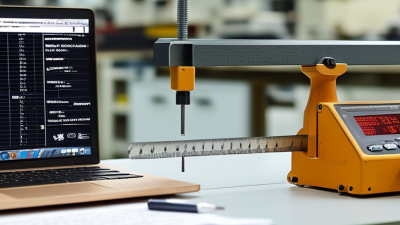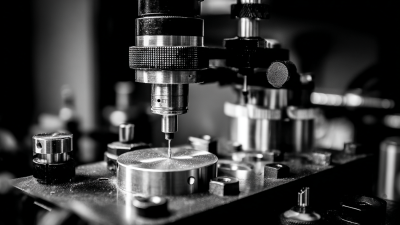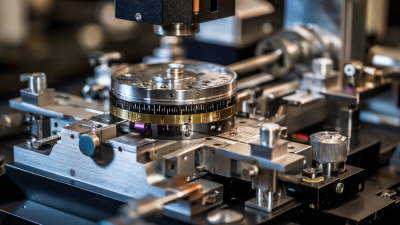
Precision instruments are tools designed to measure, control, or position physical quantities with exceptional consistency. They help engineers observe details that ordinary equipment may miss, such as a temperature change of 0.01°C or a movement smaller than a human hair. Their work appears in laboratories, hospitals, factories, aircraft maintenance, and environmental monitoring.
At their core, precision instruments convert physical conditions into readable information. A digital caliper detects movement through electronic sensors. An optical instrument uses light, lenses, and carefully aligned scales. A pressure gauge responds to force applied to a flexible diaphragm. Software may then filter signals, correct known errors, and display a practical result. Calibration against a trusted reference gives the measurement meaning. Without calibration, impressive digits can still be misleading.
Small details matter.
Temperature, vibration, dust, and operator technique can change results. Even a stable instrument has uncertainty, which should be reported rather than hidden. This is where professional judgment becomes important. A technician checks calibration records, follows documented procedures, and compares unusual readings with independent evidence. However, no instrument is perfectly objective. Design assumptions, worn components, and poor sampling can weaken reliable conclusions. That limitation deserves attention, not decoration. Understanding how precision instruments work therefore means studying both their mechanisms and their boundaries. It also means asking whether the measurement is suitable for the decision being made. A highly precise reading is not automatically accurate, useful, or trustworthy.
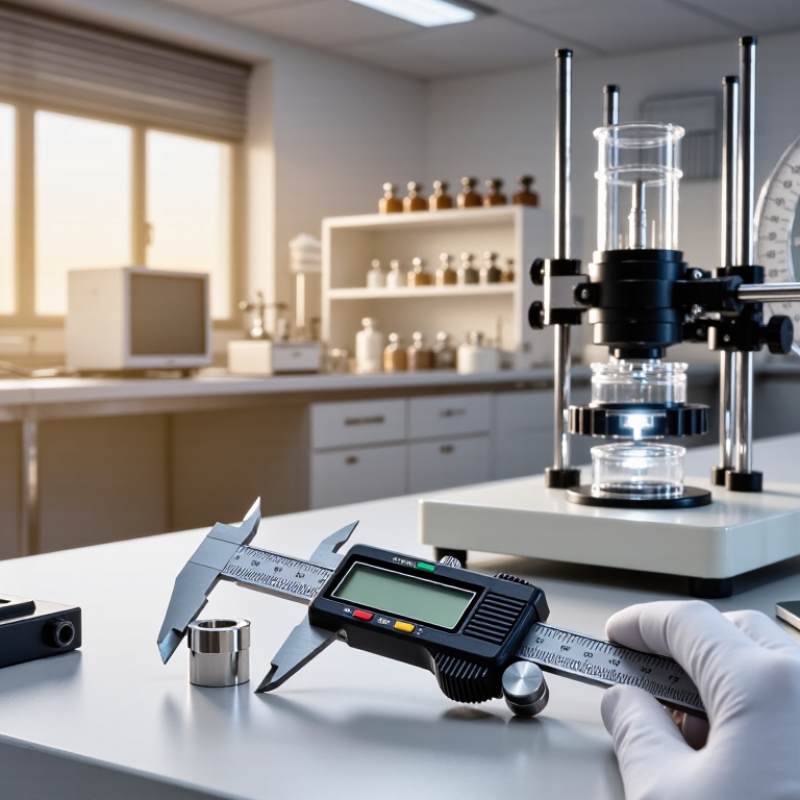
Precision instruments are tools designed to measure, control, or position objects with very small differences. A micrometer can detect tiny changes in thickness. A laboratory balance can reveal minute changes in mass. Their value comes from controlled measurement, not appearance or complexity.
Precision has several core characteristics. Accuracy describes how close a reading is to the true value. Precision describes how consistently the instrument repeats a reading. Resolution shows the smallest change it can display. These qualities are related, but they are not identical. A device may produce repeated results while remaining incorrectly calibrated. That distinction is easy to miss.
Calibration compares an instrument with a trusted reference. Technicians also consider temperature, vibration, humidity, and operator technique. For example, a metal measurement can shift slightly as the material warms in the hand. Clean contact surfaces matter too. In practical work, I have found that careful setup often improves results more than faster operation. Still, no instrument is perfectly precise. Even a stable reading contains some uncertainty. Recording that uncertainty makes technical data more honest and useful. Some measurements may also need independent verification, especially when a small error could affect safety, manufacturing quality, or scientific conclusions.
Precision instruments measure small dimensions, forces, temperatures, or movements with controlled accuracy. Their value depends on both design and proper handling. A micrometer measures thickness or diameter through a fine screw mechanism, often revealing differences smaller than a basic ruler can show. Vernier calipers handle outside, inside, and depth measurements. Technicians use them to inspect machined parts, laboratory samples, and assembly gaps.
Different instruments serve different applications. Dial indicators detect tiny shifts in alignment, runout, or flatness. Pressure gauges support process monitoring in pipes, test equipment, and mechanical systems.
Coordinate measuring machines use a probe to record points across a component, helping engineers verify complex shapes. Optical instruments, including measurement microscopes, examine surface defects and fine features without touching fragile materials. Temperature and force sensors convert physical changes into electrical signals for automated control. Each type has limits. No instrument is universally precise.
Tips: Clean contact surfaces before measuring. Check zero settings and use the correct measuring force. Temperature matters, especially with metal parts. I have seen a warm component produce a convincing but incorrect reading. Calibration records improve trust, yet calibration alone cannot fix poor technique. Repeat important measurements from different positions. If results disagree, pause and inspect the instrument, the part, and the method. Small errors often begin with rushed handling.
Precision instruments translate physical events into traceable numbers. They measure length, mass, temperature, pressure, voltage, or time. The process usually combines a sensing element, signal conversion, and calibration. A thermocouple converts heat into voltage. A load cell changes mechanical force into an electrical signal. Software then displays the measured value.
Reliable measurement depends on reference standards. The BIPM’s SI Brochure defines seven base units, including the metre, kilogram, and second. NIST Technical Note 1297 explains that measurement uncertainty should include repeatability, instrument resolution, and calibration data. A reported result with a coverage factor of k=2 commonly represents about 95% confidence. That number matters. A display showing 25.00°C may still hide sensor drift, room airflow, or poor contact. In laboratory practice, operators compare instruments with certified references before critical testing. Yet even careful procedures can fail. A loose cable or rushed zero adjustment can distort an otherwise precise reading.
Tips: Let the instrument reach thermal stability. Check zero before measurement. Record the environment, not only the result. Use calibration intervals based on risk and usage. Never confuse high resolution with high accuracy. A device may show many decimal places while measuring the wrong value. Reviewing uncertainty budgets is also useful, although they can feel unnecessarily complicated during routine work.
Precision instruments convert physical changes into trustworthy measurements. Their key components include a sensing element, a reference system, signal conditioning, a display, and a stable housing. A temperature sensor may detect resistance changes, while an optical encoder counts tiny movements. The instrument then filters noise and converts the signal into a readable value.
Calibration gives the result meaning. NISTIR 6969 recommends reporting expanded uncertainty with a coverage factor of k=2, which represents approximately 95% confidence under normal assumptions. That number matters. A micrometer showing 25.000 mm is not automatically accurate. Its result depends on temperature, alignment, operator pressure, and reference standards. I have seen small handling errors exceed the instrument’s stated resolution.
Modern systems also depend on traceability. The BIPM SI Brochure, 9th edition, defines the International System through seven base units and fixed numerical values for fundamental constants. This framework lets laboratories compare measurements across countries. Inside the instrument, feedback control can correct drift, but correction is never magic. Sensors age. Cables introduce interference. Even a clean laboratory has vibration and humidity. NIST guidance therefore emphasizes repeatability, documented procedures, and uncertainty budgets. A useful design separates the measured signal from environmental effects, yet that separation is imperfect and must be checked through repeated tests.
| Instrument Type | Primary Measurement | Key Components | Operating Principle | Typical Resolution | Main Accuracy Influences | Common Applications |
|---|---|---|---|---|---|---|
| Vernier Caliper | Outside diameter, inside diameter, depth, and step dimensions | Main scale, vernier scale, jaws, depth rod, locking screw | Compares the graduated vernier scale with the main scale to interpolate fractional divisions. | 0.02–0.05 mm | Jaw wear, dirt on contact surfaces, excessive measuring force, parallax, and temperature changes | General dimensional inspection and workshop measurement |
| Micrometer | Small external, internal, or depth dimensions | Precision screw, spindle, anvil, sleeve, thimble, ratchet stop | Rotational motion of a fine-pitch screw is converted into controlled linear movement of the spindle. | 0.001–0.01 mm | Screw-pitch error, thermal expansion, contact pressure, alignment, and anvil contamination | High-precision measurement of thicknesses, diameters, and manufactured parts |
| Dial Indicator | Small displacement, runout, flatness, and alignment | Contact tip, plunger, rack-and-pinion mechanism, pointer, dial, bezel | Linear movement of the contact point is mechanically amplified and displayed by a pointer. | 0.001–0.01 mm | Probe angle, mechanical backlash, mounting rigidity, vibration, and contact friction | Checking shaft runout, machine-tool alignment, and surface variation |
| Coordinate Measuring Machine | Three-dimensional coordinates and geometric features | Granite or rigid structure, guideways, probing system, scales, controller, software | Measures probe positions along multiple orthogonal axes and calculates dimensions from coordinate data. | Sub-micrometre to micrometre range | Thermal gradients, structural vibration, probe qualification, guideway errors, and calibration quality | Dimensional verification of complex mechanical components |
| Optical Comparator | Profile, contour, angle, radius, and two-dimensional dimensions | Light source, condenser, stage, lens system, projection screen, measurement scales | Projects a magnified silhouette of an object onto a screen for visual or digital comparison with a reference. | Approximately 0.001–0.01 mm, depending on system | Lens distortion, focus, lighting uniformity, edge definition, stage accuracy, and operator interpretation | Inspection of small parts, profiles, tools, and formed components |
| Laser Interferometer | Distance, displacement, straightness, and motion accuracy | Stable light source, beam splitter, mirrors, retroreflector, photodetector, signal processor | Uses changes in optical interference fringes to determine displacement related to the wavelength of light. | Nanometre-scale resolution is achievable | Air temperature, pressure, humidity, refractive-index variation, optical alignment, and vibration | Calibration of precision stages, machine tools, and motion systems |
| Electronic Balance | Mass | Load cell, electromagnetic force-compensation system, sensor, amplifier, display, leveling system | Detects the force produced by a load and converts the sensor response into a mass reading. | Milligram to microgram range, depending on design | Air currents, vibration, temperature, buoyancy, magnetic materials, and unstable leveling | Laboratory weighing, formulation, material testing, and quality control |
| Digital Pressure Gauge | Absolute, gauge, or differential pressure | Pressure port, diaphragm, strain sensor, signal conditioning circuit, display | Pressure deflects a diaphragm or changes a sensing element; electronics convert the response into a pressure value. | Commonly 0.01–0.1% of full scale | Sensor hysteresis, temperature, overpressure, fluid compatibility, leaks, and calibration drift | Process monitoring, hydraulic testing, pneumatic systems, and laboratory measurement |
| Thermocouple Thermometer | Temperature | Two dissimilar metal conductors, measurement junction, reference junction, wiring, signal converter | Generates a thermoelectric voltage related to the temperature difference between the measurement and reference junctions. | Typically about 0.1–1 °C in practical use | Reference-junction compensation, wire quality, thermal conduction, response time, and electromagnetic noise | Industrial ovens, engines, furnaces, and temperature-process monitoring |
| Digital Multimeter | Voltage, current, resistance, and selected electrical quantities | Input protection, shunt resistor, voltage divider, analog-to-digital converter, display | Conditions an electrical signal, converts it into a digital value, and applies calibration factors before display. | Often 3½ to 6½ display digits | Reference stability, input loading, lead resistance, bandwidth, temperature, and calibration | Electrical testing, troubleshooting, laboratory measurement, and equipment maintenance |
| Surface Roughness Tester | Surface texture parameters such as Ra and Rz | Stylus, pickup sensor, traverse drive, filter, amplifier, processor | Moves a stylus across a surface and converts vertical profile changes into a digital roughness trace. | Nanometre to micrometre profile sensitivity | Stylus-tip condition, cutoff length, vibration, surface cleanliness, filter selection, and measurement direction | Machined-surface inspection and manufacturing process control |
| Precision Level | Small angular deviation or inclination | Sensitive vial or electronic inclinometer, housing, reference base, damping system | Detects the movement of a liquid bubble or sensor mass relative to a calibrated reference axis. | Seconds of arc to arc-minute range | Base flatness, temperature, vibration, surface contamination, and instrument orientation | Machine installation, alignment, leveling, and metrology work |
Precision instruments measure physical quantities with controlled resolution and repeatability. Their sensors convert temperature, pressure, mass, or length into readable signals.
Accuracy describes closeness to a reference value. Precision describes how tightly repeated readings cluster. They are not the same.
ISO 5725 separates trueness from precision, which is essential when judging laboratory results. A highly precise instrument can still produce consistently wrong measurements.
Calibration compares an instrument with a traceable reference under defined conditions. It does not automatically improve the instrument. Instead, it reveals bias and supports correction decisions.
NIST Technical Note 1297 recommends reporting measurement uncertainty through Type A and Type B evaluations. A coverage factor of k = 2 often represents about 95% coverage, when normal assumptions are reasonable.
Temperature drift, vibration, operator technique, sensor aging, and electrical noise can still distort results.
Tips:
Record the environment. Let instruments stabilize. Check zero before testing. Use certified references with a clear traceability chain.
Keep calibration intervals based on risk, usage, and historical drift, not habit alone. JCGM 100:2008 recommends building an uncertainty budget rather than reporting a single confident number.
In practice, the displayed value may look exact while the surrounding uncertainty remains unclear. That is an uncomfortable but useful limitation. A second check may expose mistakes in setup, not instrument failure.
3295 Cobb International Blvd.
Kennesaw, GA 30152
800-367-1377
sale@patiostools.com
© 2023 - Marsh Instruments